How to Identify Trend Reversals in the Market
Identifying trend reversals is one of the most crucial tasks for traders and investors in financial markets. Recognizing when a trend changes direction can greatly impact the success of trading strategies. In this guide, we’ll discuss how to spot trend reversal signals and analyze key indicators and concepts. You’ll also learn how to catch trends on a chart in various market situations.

What is a Trend Reversal?
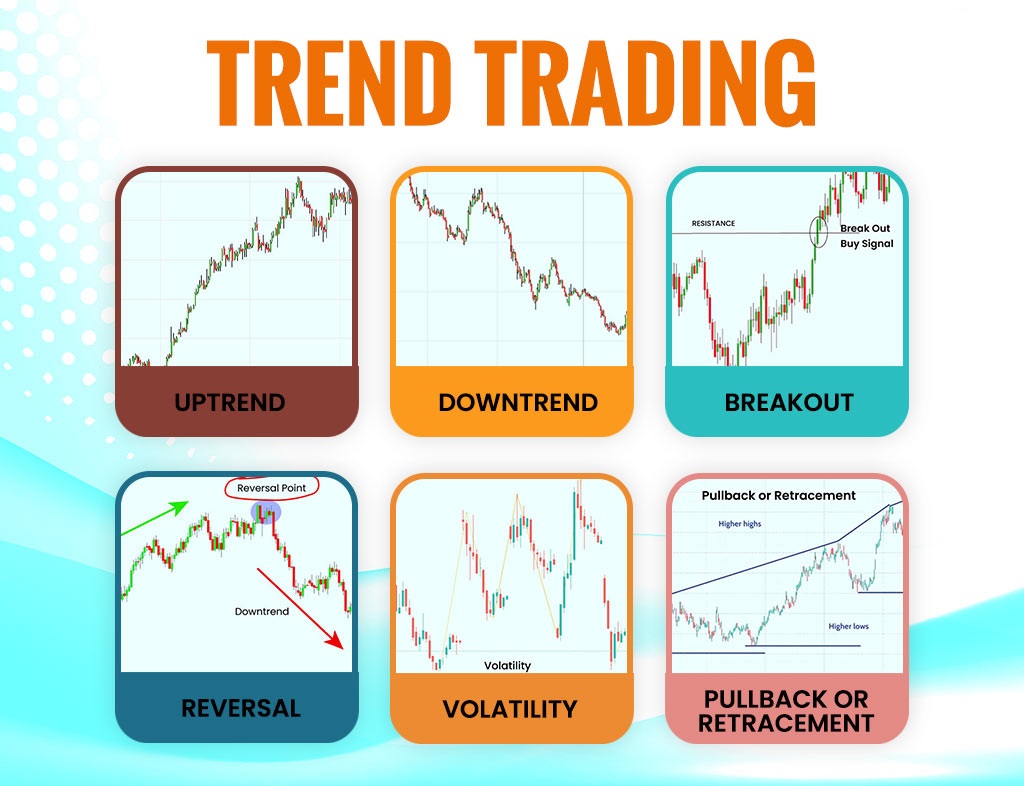
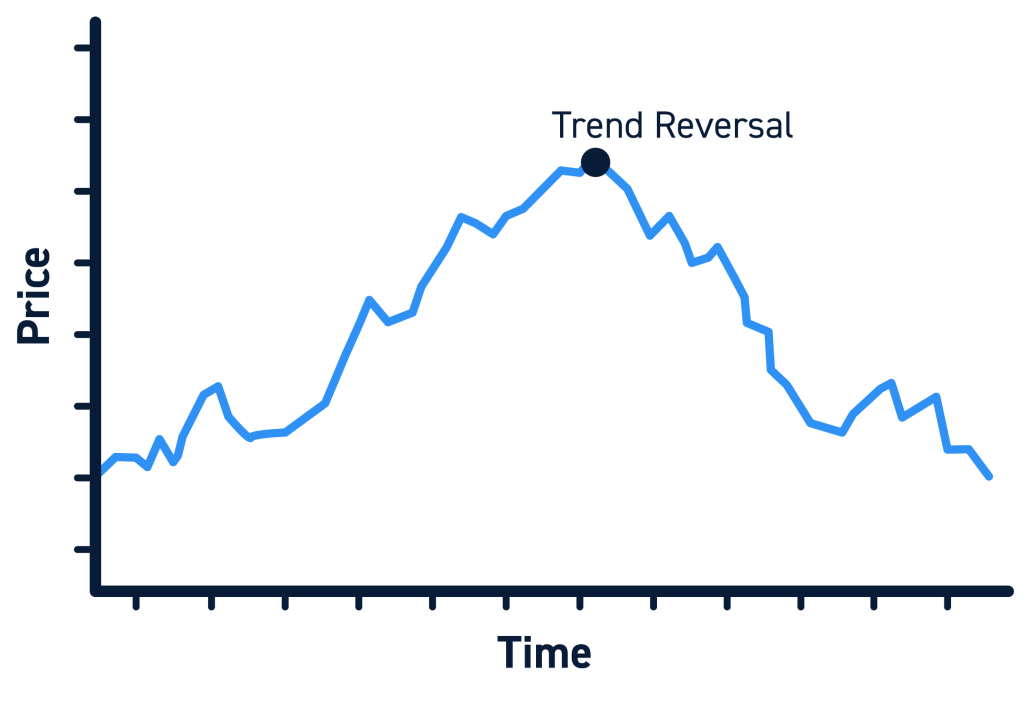
A trend reversal refers to a change in the general direction of an asset’s price movement from an upward trend to a downward one, or vice versa. Trading with and against trends is a key skill for any experienced trader. For example, if a stock has been rising for an extended period, forming an uptrend, a trend reversal indicates a switch to a downtrend. It’s important to note that a trend reversal is not an instant event but rather a process that may take some time to develop. On a chart, this often appears as the formation of a new high or low, after which the price begins to move in the opposite direction. A classic example of a trend reversal occurred in the cryptocurrency market in late 2017 to early 2018, when Bitcoin’s price soared to nearly $20,000, followed by a reversal, with the price dropping by more than 80% over the next year. Trend reversals can happen on various timeframes, from intraday charts to longer-term monthly and yearly charts. However, short-term reversals do not necessarily indicate a change in the long-term trend. For instance, short-term corrections can occur within a longer bullish trend without altering the overall upward trajectory of indices.
Key Methods for Identifying Trend Reversals
To spot trend reversal patterns, a combination of different factors is necessary:- Technical Indicators Tools like moving averages, RSI (Relative Strength Index), and MACD (Moving Average Convergence Divergence) are useful for detecting potential trend reversals. For example, when the price moves below a long-term moving average after a period of rising, it could signal a reversal.
- Chart Patterns Certain chart patterns like head and shoulders, double tops, and double bottoms are often indicative of a trend reversal. A head-and-shoulders pattern, for instance, signals that an uptrend may reverse into a downtrend.
- Volume Indicators Changes in trading volume can help confirm a trend reversal. Typically, volume increases when a trend reversal occurs, signaling strong momentum in the new direction.
- Fundamental Data Economic indicators, company earnings, or geopolitical events can cause shifts in investor sentiment and lead to trend reversals. Monitoring these fundamentals is essential, particularly in volatile markets.
How to Predict the Trend Reversal Point?
Any trend reversal strategy is based on analyzing market psychology. When most market participants are confident that the current trend will continue, this often signals its imminent end. For example, during the peak of the dot-com bubble in 2000, many investors were convinced of the endless growth of tech stocks, which turned out to be a precursor to a major market crash. The Role of Fundamental Factors Changes in economic policies, unexpected news, or shifts in market conditions can act as catalysts for a trend reversal. For example, a decision by the Federal Reserve to raise interest rates can lead to a reversal in an upward trend on the stock market.Technical Analysis Tools for Identifying Trend Reversals
Technical analysis offers several tools to identify potential reversal points:- Support and Resistance Levels
- Chart Patterns: Double tops, head and shoulders, etc.
- Divergences: Between price and technical indicators.
- Candlestick Patterns
- Volume Analysis: A sharp increase in trading volume combined with slowing price movement often indicates an approaching reversal.
Tools for Determining Trend Reversals
Before identifying a trend reversal, you’ll need one or more indicators. Let’s look at three effective tools commonly used:- RSI (Relative Strength Index): RSI measures the speed and magnitude of directional price movements, ranging from 0 to 100. Traditionally, values above 70 indicate an overbought asset, while below 30 suggest oversold conditions. Divergences between price and RSI often signal a reversal. For instance, if the price forms new highs while RSI declines, it may indicate an imminent reversal in an uptrend.
- Moving Averages (MA): Some consider MA the best indicator of trend reversals. Moving averages smooth out price fluctuations and reveal the overall trend direction. The crossing of moving averages with different periods can indicate a potential reversal. A popular approach is using a combination of short- and long-term MAs. When the short-term MA crosses the long-term one from below, it may signal the beginning of an uptrend and vice versa. Another significant signal is when the price crosses a key moving average, like the 200-day MA.
- Fibonacci Levels: Based on the Fibonacci sequence, these levels are used in technical analysis to identify potential reversal zones. The most critical levels are 38.2%, 50%, and 61.8%. If the price reaches one of these levels and starts to bounce back, it may indicate a reversal of the current trend. Fibonacci levels are particularly effective when combined with other technical analysis tools.
Conclusion
You can use any accurate trend reversal indicator to identify entry points for trades. However, the key to effectively applying these methods lies in continuous learning and practice. Markets are constantly evolving, with new tools and analysis strategies emerging. Therefore, it’s critically important for traders and investors to maintain a culture of lifelong education.